
SPECIAL REPORT
PRECIOUS METALS


Photo credit: Boliviainteligente on Unsplash.com.
Silver and platinum group metals join gold’s surge
in a breakout year for precious metals

By Vaishali Banerjee
President
CIBJO Precious Metals Commission
2025 was a landmark year for precious metals. After two years of gold leading investment flows, silver, platinum and palladium joined the rally in 2025, with silver, gold and platinum reaching record highs and palladium posting strong gains.
There was a substantial rise in physical investments as well as exchange-traded products (ETP) related growth. A growth in investment in coins and bars was observed even amongst retail consumers, indicating a rise in the number of people who view precious metals as an investment asset.
In general, the global economy exhibited exceptional resilience as it grew at 3.4 percent in 2025, as per the IMF. The economic outlook improved after the first quarter, as the initial U.S. tariffs were moderated through subsequent resets and trade agreements. The United States’ GDP growth came in lower at 2.1 percent due to lower exports as well as government spending. China’s GDP growth remained steady at 5 percent, as the country reoriented its exports to other Asian and European economies. Global headline inflation is expected to rise to 4.4 percent in 2026 from 4.1 percent in the previous year, on account of higher energy prices. The IMF projects global growth to come in slower at 3.1 percent.
An important dynamic was evident during the year in the precious metals markets. While higher prices weighed on volume, jewellery purchase value increased significantly, reflecting sustained consumer demand. Yet another trend was cross-metal substitution at both ends of the market. The high-end market saw some shifts to platinum from gold, while, at the lower end, gold-plated silver jewellery rose in markets like India and China – indicating that jewellery demand remains resilient, even as consumer purchasing patterns evolve.
Industry associations as well as global financial institutions continued to work towards bringing transparency as well as accountability into gold mining as a part of ESG initiatives. The World Gold Council expanded its canvas on the climate change effects of mining to nature and biodiversity, bringing in more accountability to the sector.
CIBJO has continued to bring in more accountability into the jewellery sector. During the year, the confederation expanded its bouquet of methodologies that support responsible and sustainable practices of jewellery companies. It updated its Responsible Sourcing Blue Book and Toolkit, and came up with a new ESG and Sustainability Reference Guide, and a new ESG Wheel and Implementation Guide. It provides a comprehensive, practical framework to help jewellery companies understand, prioritise and act on ESG issues across their supply chains.
The Responsible Sourcing Blue Book and Toolkit helps develop and strengthen responsible sourcing policies, conduct proportionate supply chain due diligence, and identify and manage risks related to human rights, labour, governance and product integrity, amongst other things.
The ESG and Sustainability Reference Guide is a reference point that brings together key ESG topics relevant to jewellery supply chains, and links these ESG themes to UN Sustainable Development Goals (SDGs). It also provides an overview of international frameworks, initiatives and regulatory developments.
The ESG Wheel and Implementation Guide guides companies, particularly SMEs, on implementing an ESG strategy. The guide helps identify ESG risks, impacts and opportunities across their value chains, integrate them into their business strategies, and undertake proportionate materiality assessments. CIBJO produced the ESG Wheel, a visual model that brings together 14 ESG themes tailored to the jewellery sector.
GOLD
BRIGHTER THAN EVER IN 2025
Gold continued to gain momentum as it entered the third year of its sustained rally.
Contrary to forecasts that the metal had reached its ceiling in 2024, prices surged another 44 percent in 2025. Spot gold prices saw 56 new record highs in 2025, underpinning its role as a safe haven asset across the globe.
In the first quarter, the gold price averaged $2,860 per ounce, moving up by 7 percent from the quarter before. In the second quarter, it went up 15 percent to $3,279 and remained stable at $3,457 for the third quarter. In the fourth quarter, the price rose exponentially, closing at an average of $4,135 per ounce.
The year 2025 started with concerns about global growth, inflation, and a transition in supply chains – as the U.S. tariff threat loomed large. All these factors eased the flow of investments into gold, thereby elevating its safe-haven status.
Pressure on the U.S. dollar intensified during the year amid concerns over rising government debt, policy uncertainty and questions around Federal Reserve independence. While a weaker dollar would typically weigh on gold, these uncertainties instead accelerated central bank diversification into gold. Although below the record levels of the previous three years, net central bank purchases remained robust at 848 tonnes (27.2 million ounces).
Gold prices defied another historical correlation in 2025. Despite strong equity markets, increasingly stretched valuations reinforced gold’s role as a portfolio hedge, driving further price appreciation.
Gold’s positive outlook is expected to continue into 2026, underpinned by ongoing policy uncertainty, trade tensions and diversification away from the U.S. dollar. As governments seek to stimulate growth while containing inflation, gold’s macroeconomic tailwinds are likely to strengthen. While the West Asia crisis has impacted gold prices in the first quarter of the year, gold’s role as a hedge against portfolios is expected to continue.
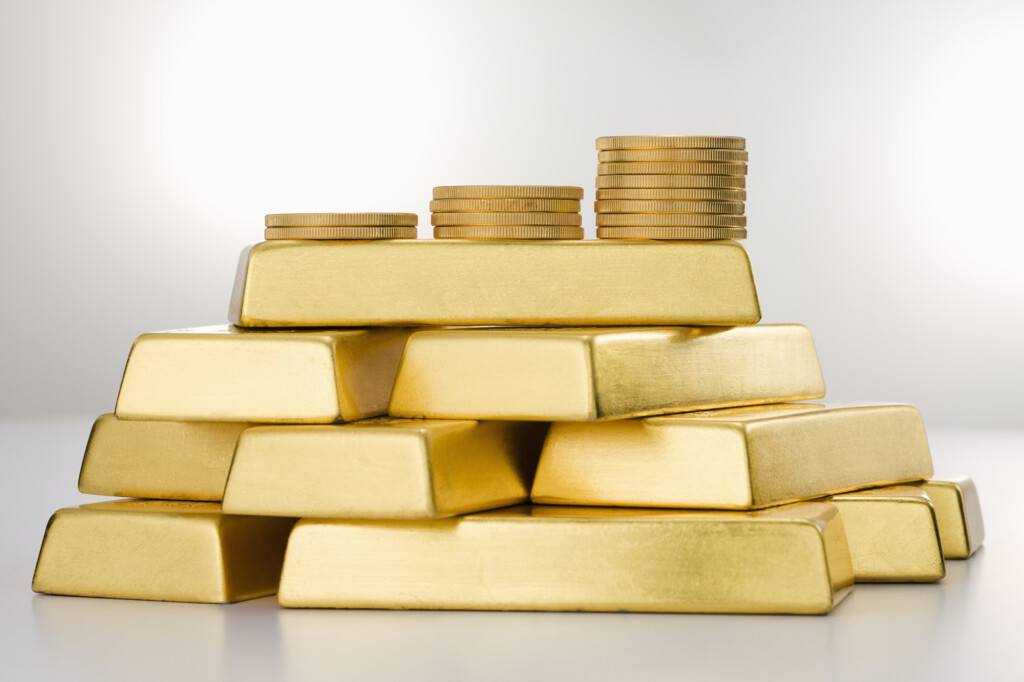
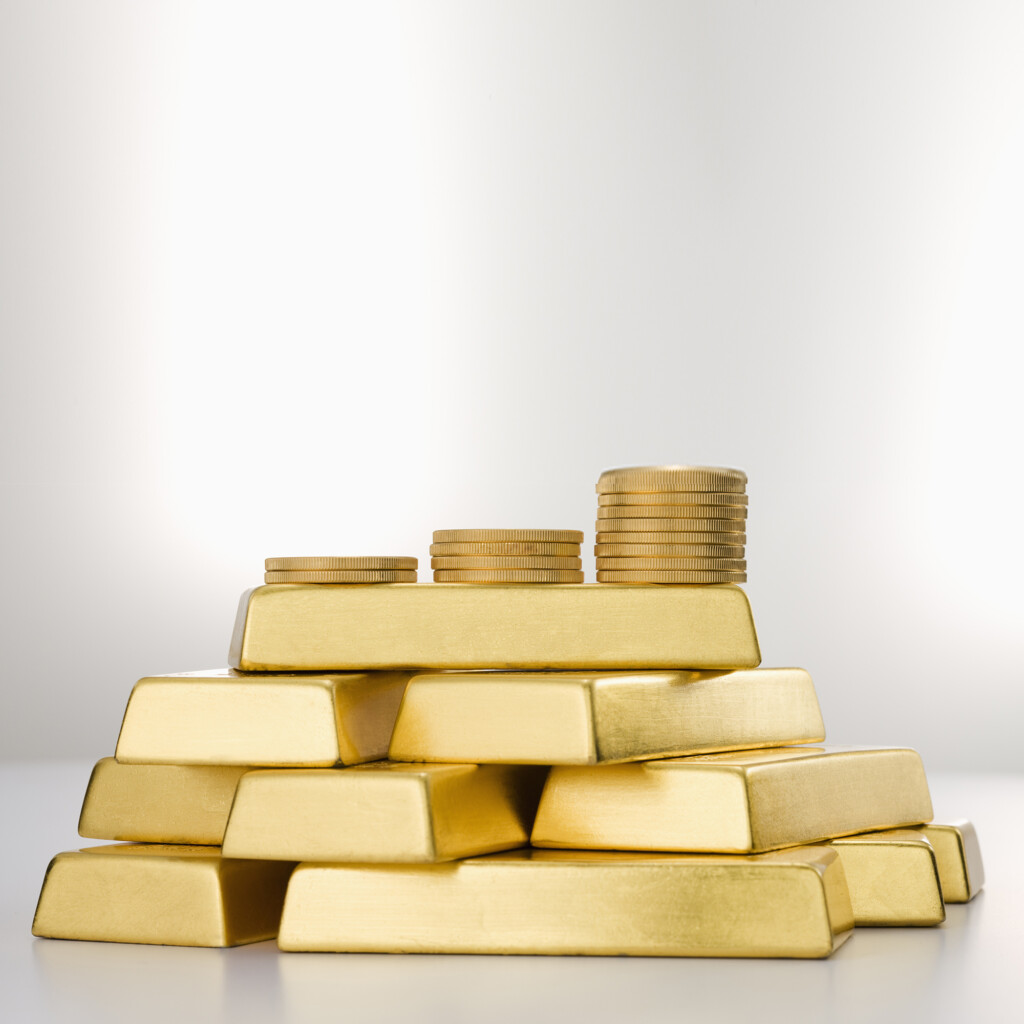
Photo credit: Ayala-Studio on Unsplash.com .
Supply: New avenues emerge
Globally, gold mine production went up by 2 percent year-on-year in 2025, to a record high of 122.7 million ounces (3,817 tonnes). The sharp increase in price led to new mine ramp-ups, project expansions, and increased artisanal and small-scale gold mining (ASGM).
The supply growth was not uniform across regions; Asian supply growth declined across many nations, while that of Africa and North America rose. Growth in the African region was led by Zimbabwe with 24 percent year-on-year growth in supply to 2 million ounces (62.4 tonnes). In Ghana, the commissioning of a new mine, Newmont’s Ahafo North, along with ASGM activity, pushed up its supply by 21 percent to 6 million ounces (187.3 tonnes).
Large producers such as China and Russia increased their gold supply by 1 percent to 12.3 million ounces (384.3 tonnes) and 5 percent to 11 million ounces (342 tonnes) respectively. In contrast, production in Indonesia and Mali declined by 25 percent to 3.35 million ounces (104.2 tonnes) and 17 percent to 2.6 million ounces (80.9 tonnes) due to operational challenges, lower ore grades and government intervention. Canada’s output rose 5 percent to 6.8 million ounces (213.3 tonnes), which is a decade high, while U.S. production fell 4 percent for an eighth consecutive year to 5 million ounces (157 tonnes). Chile (+33 percent to 1.5 million ounces or 47.6 tonnes) and Brazil (+8 percent to 2.8 million ounces or 87.4 tonnes) benefited from new mine production, while ASGM supported growth in Bolivia and Peru. Despite a 12 percent increase in production costs driven by higher royalties and inflation, record gold prices improved the profitability of mining companies.
Gold recycling reached a 13-year high in 2025, rising 2.8 percent to 45 million ounces (1,404 tonnes). However, its growth was modest relative to the sharp increase in prices, as consumers largely chose to hold on to an appreciating asset amid uncertainty. Recycling increased in Europe and North America, was broadly stable in China and Japan, and declined in the Middle East and South Asia. In India, consumers increasingly exchanged old jewellery for new purchases or leveraged it for gold loans rather than selling it outright.
In 2026, global supply is expected to rise by 2.4 percent year-on-year to 125.6 million ounces (3,907 tonnes), reaching another record high with higher mine output from Ghana, Mali, and Indonesia, as well as ASGM activity.
Demand: Investment rises as jewellery fabrication falls
Net gold demand declined 9 percent to 137.4 million ounces (4,275 tonnes) in 2025, with demand contracting across all segments except physical investment. Higher prices weighed on jewellery purchases, driving a 19 percent decline in fabrication demand to 52.9 million ounces (1,646 tonnes), while industrial demand fell 1 percent to 10.3 million ounces (323 tonnes). The producer hedging demand also contracted by 4 percent to 1.7 million ounces (54 tonnes) as record gold prices reduced the incentive for forward sales, allowing producers to benefit from further price appreciation.
Net physical investment demand increased 16 percent to a record 45.1 million ounces (1,404 tonnes) in 2025. Gold’s strong price momentum and safe-haven appeal attracted robust investment demand, led by Asia and Europe. In 2025, physical investment overtook jewellery demand in China and India, where investment demand went up by 28 percent to 13.8 million ounces (432 tonnes) and 17 percent to 9 million ounces (280 tonnes) respectively. This is a significant repositioning, as both have traditionally been dominant jewellery markets. The Middle East’s investment demand contracted by 14 percent to 6.2 million ounces (193.7 tonnes), while Europe saw a sharp rebound, growing 90 percent to 4.1 million ounces (128.6 tonnes).
Exchange Traded Products (ETPs) saw the second-highest annual inflows on record at 25.8 million ounces (802 tonnes). This is a reversal of sentiment, as 2024 had seen a reduction in ETP investments. This net inflow data indicates that the dominant trend was sustained accumulation, as some profit-taking was observed in gold ETPs in 2025, as the price reached many record highs during the year.
In 2025, the WGC announced a digital gold framework based on pooled gold interests, allowing investors to hold vaulted gold in varying quantities. The framework enables these ownership interests to be used as collateral or transferred securely between parties without requiring physical movement of the metal.
Central bank purchases reduced by 22 percent to 848 tonnes (27.2 million ounces), after three years of steady, substantial annual purchases. Brazil, Guinea and Tanzania, which saw limited activity in the last few years, officially expanded their gold holdings in 2025, along with Poland.
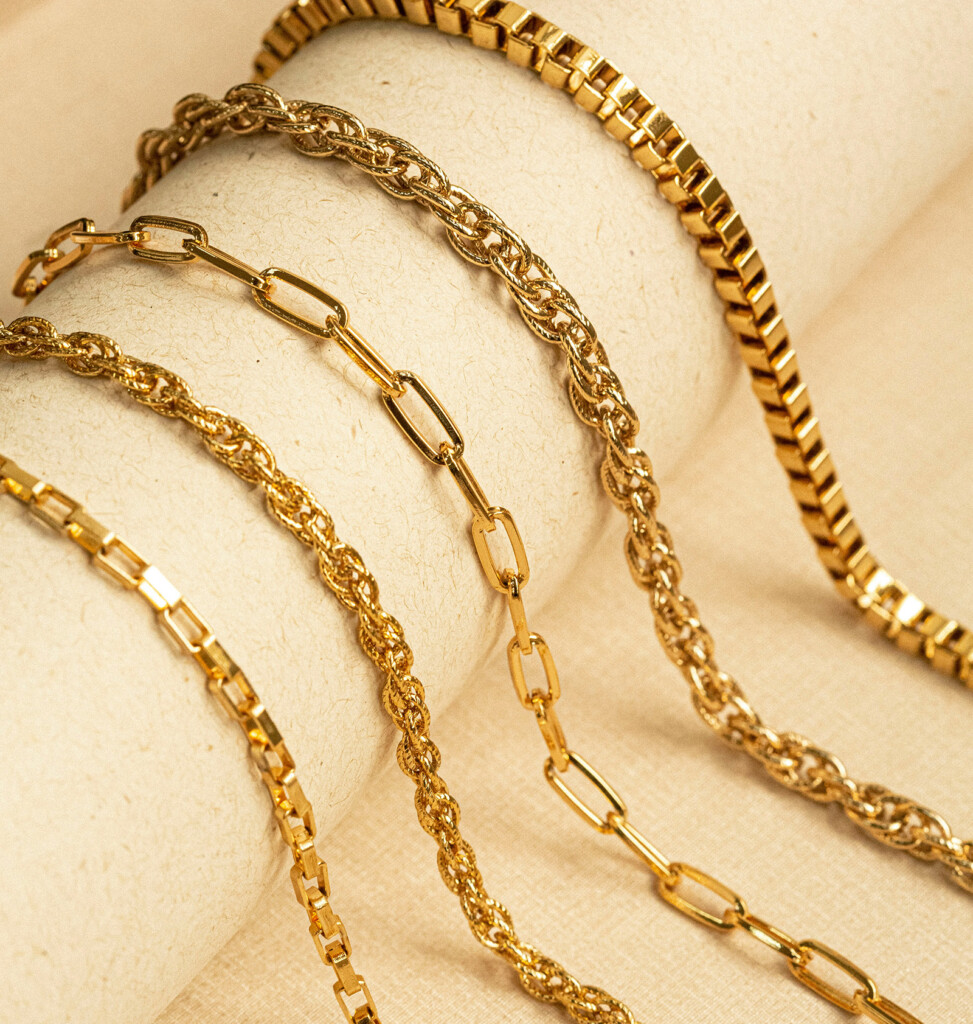
Photo credit: Ruan Richards Rodriguez on Unsplash.com
Jewellery: Leading value growth amid volume decline
Jewellery fabrication demand declined by 19 percent to a five-year low of 52.9 million ounces (1,646 tonnes) in 2025. Evolving U.S. tariff measures and policy uncertainty disrupted global jewellery supply chains, weighing on exports from key jewellery manufacturing nations such as Italy and India. Combined with rising costs, margin compression and subdued retail demand, fabricators faced a challenging operating environment.
Rising gold prices weighed on jewellery consumption across many markets. While consumer spending on jewellery remained relatively resilient, higher prices reduced the gold volume consumed. Platinum jewellery and lower-carat gold jewellery gained share as consumers sought value alternatives. Softer consumer sentiment and currency depreciation in several markets further pushed up local retail prices, adding to demand pressures.
Jewellery fabrication demand declined across all major markets, differing only in magnitude. European fabrication demand contracted by 11 percent to 6.6 million ounces (207.5 tonnes), with Italy – the region’s largest jewellery manufacturer – facing margin pressure from a proposed 10 percent tariff threat, since raw materials make up 90 percent of the price. Jewellery consumption declined by 9.3 percent as well.
The U.S. saw its lowest-ever gold jewellery consumption since 2014 – at 3.7 million ounces (115 tonnes), which declined by 13 percent year-on-year. Imports were impacted after the tariff was levied, but unit sales also remained low during the year. Higher gold prices, coupled with cost-of-living pressures, constrained consumer demand.
Fabrication demand was down by 18 percent in the Middle East to 7.8 million ounces (242.6 tonnes). Turkey, whose exports were hit by tariffs, saw a sharp fall in exports to all destinations.
Chinese jewellery demand was impacted by various factors including a change in the tax credit policy of value-added tax (VAT) which effectively increased retail prices of gold jewellery by 7 percent. Jewellery consumption declined by 25 percent and fabrication demand by 28 percent to 11 million ounces (344 tonnes). Manufacturers liquidated unsold gold inventory and shifted some fabrication lines to platinum. Holiday-period jewellery sales were also affected by a shift in consumer spending towards travel and entertainment. In addition, growing interest in gold ETPs and physical gold investment diverted demand away from jewellery.
Chinese antique crafted gold (ACG) gem-set collections, however, saw satisfactory growth, while the 5G gold product range expanded. 5G is the fifth-generation innovative gold design that creates designs with 99.9 percent gold purity with increased toughness – to overcome gold’s natural malleability. However, 3D/5D gold (third and fifth-generation designs with hollow interiors) underperformed 5G gold due to higher prices and labour costs. Initiatives were launched by associations along with large retail jewellers of China to create an export market for these innovative gold products.
Japan’s gold jewellery demand declined by 19 percent due to a sharp local gold price rally. Kihei chain sales held on to their demand, cushioning some of the decline. Luxury gold jewellery demand was stable, while younger value-conscious buyers gravitated towards lower-carat jewellery. Brands launched K7 classic collections with a high concentration of gold purity, and positioned them as an investment asset.
Indian jewellery consumption declined by 22 percent year-on-year in 2025 to 14.1 million ounces (441 tonnes) – as rupee-gold prices rose by 70 percent during the year, amid currency depreciation. While wedding-related purchases remained resilient, daily wear and discretionary categories declined. Lower store walk-ins prompted retailers to expand their 18-carat and 14-carat gold collections designed to appeal to value-conscious consumers without compromising on aesthetics. The government also introduced 9-carat hallmarking – a significant move as the Indian market has been historically dominated by 22-carat gold. Aligned with weak consumption, India’s jewellery fabrication demand fell by 20 percent to 17.85 million ounces (555 tonnes), the lowest since the pandemic.
Gold jewellery demand is expected to remain under pressure in 2026, weighed down by weak consumer sentiment, geopolitical uncertainty in West Asia and higher energy-related inflation.
While investment demand drivers will continue to exist, elevated energy prices might drive some central banks to liquidate assets including gold in 2026. Jewellery fabrication is expected to see another year of sluggish demand. The overall demand is expected to decline further by 2 percent to 134.2 million ounces (4,177 tonnes) in 2026.
ESG: Towards increased accountability
The role of gold ASGM has been growing across nations – and now makes up a fifth of the total supply. In 2025, the World Gold Council (WGC) launched an initiative to formalise ASGM – by partnering with the World Bank as well as two large miners. The project aims to provide finance to ASGM sectors, help develop small model mines, and ensure that the mined gold is legally traded and traceable. Improved legislative frameworks can benefit all stakeholders in the ecosystem.
The WGC has also been expanding the ESG focus of gold beyond climate change, to nature and biodiversity. As per the framework, it partnered with S&P Global Sustainable1 to assess 122 mines across 30 countries. As per the published report, 71 percent of mines fell into the moderately low or low nature impact categories, while 6 percent overlapped with protected areas and 4 percent were within key biodiversity areas.
PLATINUM
A SHARP PRICE RE-RATING
Platinum prices surged to record highs in 2025, supported by persistent supply constraints and strengthening demand.
Platinum prices rallied strongly throughout 2025, doubling over the course of the year and reaching multiple record highs. The price rose by 135 percent from $977 per ounce in January to $2,303 per ounce in December. The price was rangebound in the first quarter of the year, slightly breaching the $1,000 per ounce mark in February and March. Following a brief dip to around $990 per ounce in April, platinum began a sustained rally in May.
In June, prices saw a breakout and hit a record high of $1,402 per ounce as jewellery fabrication demand drove up prices. It maintained its upward swing in July, as it climbed up, breaking another record of $1,474 per ounce. After easing slightly to $1,361 per ounce in August, platinum resumed its upward trajectory from September as investor interest and liquidity strengthened.
Between September, October and November, it traded at $1,600 per ounce levels. The metal saw its sharpest rise in December as it went up to $2,303 per ounce.
The platinum market has been in a structural deficit for the last few years, but in 2025, supply constraints matched by growing demand widened the gap. China’s growing imports of platinum by jewellery fabricators in the second half of the year remained a key factor for the deficit in the metal and its upward price movement.
With gold’s unabated bull run reaching its third year, platinum’s discount to gold had become pronounced during the year. Investors added it to the safe-haven metal investment bouquet, leading to another round of price spikes in the September to December quarter. In November, the Guangzhou Futures Exchange started trading in platinum futures, widening its investor base. The US imported a higher amount of platinum than usual.
In 2026, platinum prices are expected to consolidate at elevated levels, averaging around $2,190 per ounce. The metal underwent a significant re-rating in 2025, supported by rising investor interest, increasing gold substitution and tight supply conditions. All these drivers are expected to subside in 2026, limiting a huge upside to its price movement.
Photo credit: Platinum Guild International (PGI)
Platinum Supply: Lower mine production
Platinum supply declined by 1 percent in 2025 to 7,236 thousand ounces (225 tonnes), as mine output declined by 4 percent to 5,557 thousand ounces (172.8 tonnes) across geographies. In the first quarter, most miners met their production targets, but supply became more volatile in the later quarters of the year.
South African production was affected by planned maintenance shutdowns and adverse weather conditions. Heavy rains and floods in the northern part of South Africa from February to June halted mine operations. The output of one of the world’s largest production sites, the Amandelbult Complex, was impacted for around six months. Due to the build-up of semi-finished materials that later led to an inventory drawdown, the nation’s production came in lower by 4 percent year on year to 3,957 thousand ounces (123 tonnes), compared with the higher base effect of 2024.
Zimbabwe and Russian production remained largely unchanged. North American production, however, had the largest impact, with Canadian supply falling by 7 percent to 149 thousand ounces (4.6 tonnes), and the U.S. by 40 percent to 63 thousand ounces (1.9 tonnes).
Secondary supply via recycling went up by 9 percent during the year to 1.7 million ounces (52.8 tonnes). Most of the growth came from higher automotive and jewellery recycling. Europe and North America were unable to realise the full potential of recycling due to soft steel scrap prices as well as macroeconomic factors such as limited credit and working capital. China, however, moved the market with its national vehicle scrappage subsidies, while Japan edged down slightly.
A sharp rise in platinum prices pushed jewellery recycling in the later part of the year, which rose 20 percent year-on-year to 356 thousand ounces (11 tonnes), led by China.
The overall platinum supply is expected to rise by 2 percent to 7,377 thousand ounces (229.4 tonnes) in 2026. Mine supply is expected to remain broadly stable, with a modest increase in South African production offset by lower output from Russia and North America. Recycling, however, is expected to increase by 9 percent to 1.8 million ounces (55.9 tonnes), with growth across jewellery, auto catalyst and electronics.
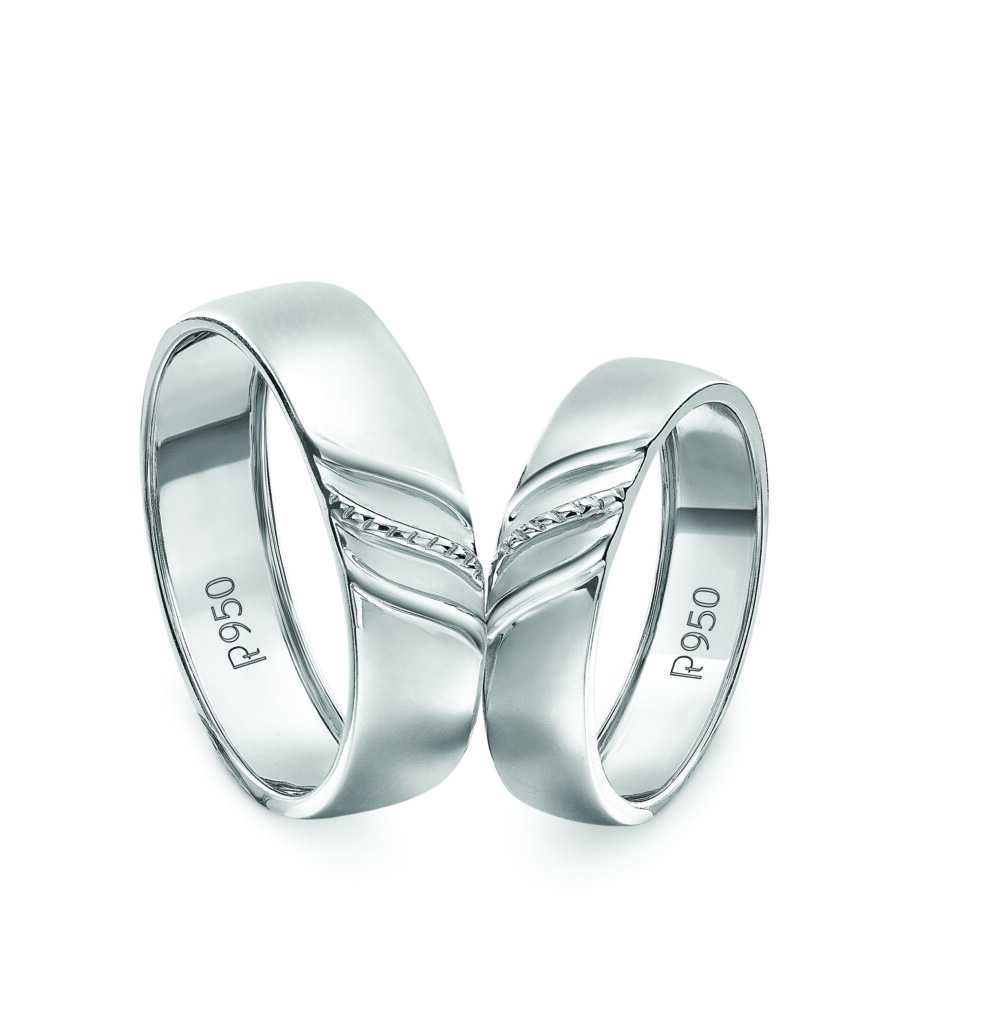
Photo credit: Platinum Guild International (PGI)
Platinum Demand: Jewellery and investment leads demand
Platinum demand contracted by 2 percent year-on-year to 7.6 million ounces (239 tonnes). While industrial demand fell sharply, strong growth in investment and jewellery demand helped partially offset the decline.
Industrial demand declined by 19 percent year-on-year to 2 million ounces (62.2 tonnes), due to weakness in the glass and chemical sectors. Glass sector demand decreased by a massive 70 percent to 206 thousand ounces (6.4 tonnes) due to glass plant closures, while chemicals saw an 8 percent drop to 578 thousand ounces (17.9 tonnes). Amongst other industries, the hydrogen and petroleum sectors saw double-digit growth at 63 percent to 65 thousand ounces (2 tonnes) and 14 percent to 182 thousand ounces (5.6 tonnes) respectively. Electronics and medical demand rose by 6 percent to 99 thousand ounces (3 tonnes) and 4 percent to 320 thousand ounces (9.9 tonnes) respectively.
Automotive demand, which is the largest contributor to overall platinum demand, declined by 2 percent year-on-year to 3 million ounces (93.3 tonnes). This was largely on the back of higher battery EV production, which does not use platinum, while the production of ICE and hybrids which use the metal reduced.
Auto demand was also not broad-based across geographies. Auto demand from Japan and China grew by 2 percent to 291 thousand ounces (9 tonnes) and 6 percent to 537 thousand ounces (16.7 tonnes) respectively. North American auto demand reduced by 6 percent (457 thousand ounces or 14.2 tonnes) and that of Europe by 8 percent (943 thousand ounces or 29.3 tonnes).
Physical investment demand surged in 2025, with bar and coin demand estimated to have almost doubled. Chinese demand nearly quadrupled during the year, as retail investors added physical precious metals to their vaults. Gains from China and India offset some of the fall seen in North America and Europe.
Platinum ETP demand was spearheaded by North American funds, as its holdings grew 6 percent year-on-year to 3.5 million ounces (108.9 tonnes).
Photo credit: Platinum Guild International (PGI)
Jewellery Demand: Price advantage drives demand
Platinum jewellery fabrication demand grew by 10 percent year-on-year to 2,214 thousand ounces (68.8 tonnes), reaching an eight-year high.
Chinese fabrication demand grew by 40 percent to a four-year high at 578 thousand ounces (18 tonnes), as jewellers pivoted to platinum jewellery to offset falling gold jewellery sales.
The Platinum Guild International (PGI) worked with large jewellery retailers to build demand for platinum jewellery via marketing initiatives. PGI China created Platinum ABC, a digital asset platform providing marketing assets to jewellery retailers to promote platinum jewellery.
In China, gem-set jewellery outperformed plain platinum jewellery during the year. Wholesalers brought out innovations like clasped bracelets to capture demand from mature customers. Pendants and bracelets were also introduced to push men’s jewellery. The sales momentum, however, was impacted by rising prices as well as the elimination of the 13 percent VAT rebate for the metal.
North American fabrication demand went up by 6 percent to 470 thousand ounces (14.6 tonnes). In the United States, the market share of platinum jewellery increased, backed by growing bridal demand. Declining diamond prices encouraged consumers to trade up to higher-carat jewellery. European demand went up by 9.8 percent to 377 thousand ounces (11.7 tonnes) year-on-year in 2025. Platinum jewellery gained as consumers shifted from higher-priced 18k white gold to platinum. Bridal jewellery demand remained resilient even amidst a general decline in jewellery spends.
Japanese demand grew 2 percent to 383 thousand ounces (11.9 tonnes) in spite of lower exports and a higher yen, which pushed up local platinum prices. Higher discretionary spending amongst certain consumer cohorts aided the growth. A new size-free, easy-to-wear collection was launched to target younger consumers.
Indian fabrication demand reduced by around 7.1 percent to 247 thousand ounces (7.7 tonnes) as the export market fell by 45 percent, deeply impacted by the U.S. tariffs. The domestic market showed resilience. Platinum men’s jewellery gained ground, supported by a celebrity-led marketing campaign featuring cricketer M.S. Dhoni to popularise platinum jewellery amongst men. Large Indian retail chains launched and marketed men’s jewellery collections in platinum to drive high-value purchases, as men’s jewellery carries a substantive weight. The wedding bands segment continued to drive sales in the bridal category.
Demand Outlook: After a good showing in 2025, platinum jewellery is expected to decline by 12 percent in 2026 to 1,958 thousand ounces (60.9 tonnes), surrendering most of the gains made in the past two years. China, which saw softer demand in the second half of the year, might contribute to most of the downturn. Moreover, policy changes in China, like the abolition of the VAT rebate for platinum, will increase retail prices for consumers. On top of an already high base price for the metal, it might deeply affect retail sales. North America and Japan are also expected to see lower volumes, while demand is expected to be stable in Europe.
Overall platinum demand across segments is expected to remain flat on the back of weak automotive demand. Industrial demand is expected to grow by 9 percent to 2,238 thousand ounces (69.6 tonnes), while investment demand is projected to remain strong, supported by increased retail investor participation.
SILVER
SHINING AS A SAFE HAVEN
The silver price grew remarkably in 2025, with spot prices hitting eight new record highs during the year. Its price grew from $29 per ounce in January to $74.8 per ounce in December – recording 145 percent year-on-year growth.
The silver price outperformed gold in 2025, reaching a steady state of structural bullishness, as per analysts. While gold has been gaining from macroeconomic factors for the last few years, the silver price lagged and even suffered due to its high exposure to industrial demand. However, in 2025, silver broke out of the lag factors. Subsequently, silver-gold ratios declined from April’s unusually high peak of 107:1 to 55:1 in December.
In the third quarter, demand from high-tech hardware for AI data centres as well as a massive photovoltaic grid construction rose sharply. Investors too expanded their bouquet of safe haven assets to silver, with a sharp rise in ETP demand from India. Its demand rose across multiple segments, on top of an existing structural deficit that dragged into the fifth consecutive year. It pushed prices to a higher $46.9 per ounce in the September quarter.
The fourth quarter saw an upsurge as the United States added silver to its critical minerals list. It resulted in industrial stockpiling and metal being tied up in ETPs – resulting in a massive supply squeeze in the London market in October. Liquidity tightness led to the silver price peaking at $74.8 per ounce in December.
The silver price waxed and waned in early 2026 with a multitude of macroeconomic factors like policy uncertainty and sovereign debt fears. However, the West Asian crisis and the subsequent supply chain reshuffling might impact industrial demand. These two diverse structural factors could determine price movements.
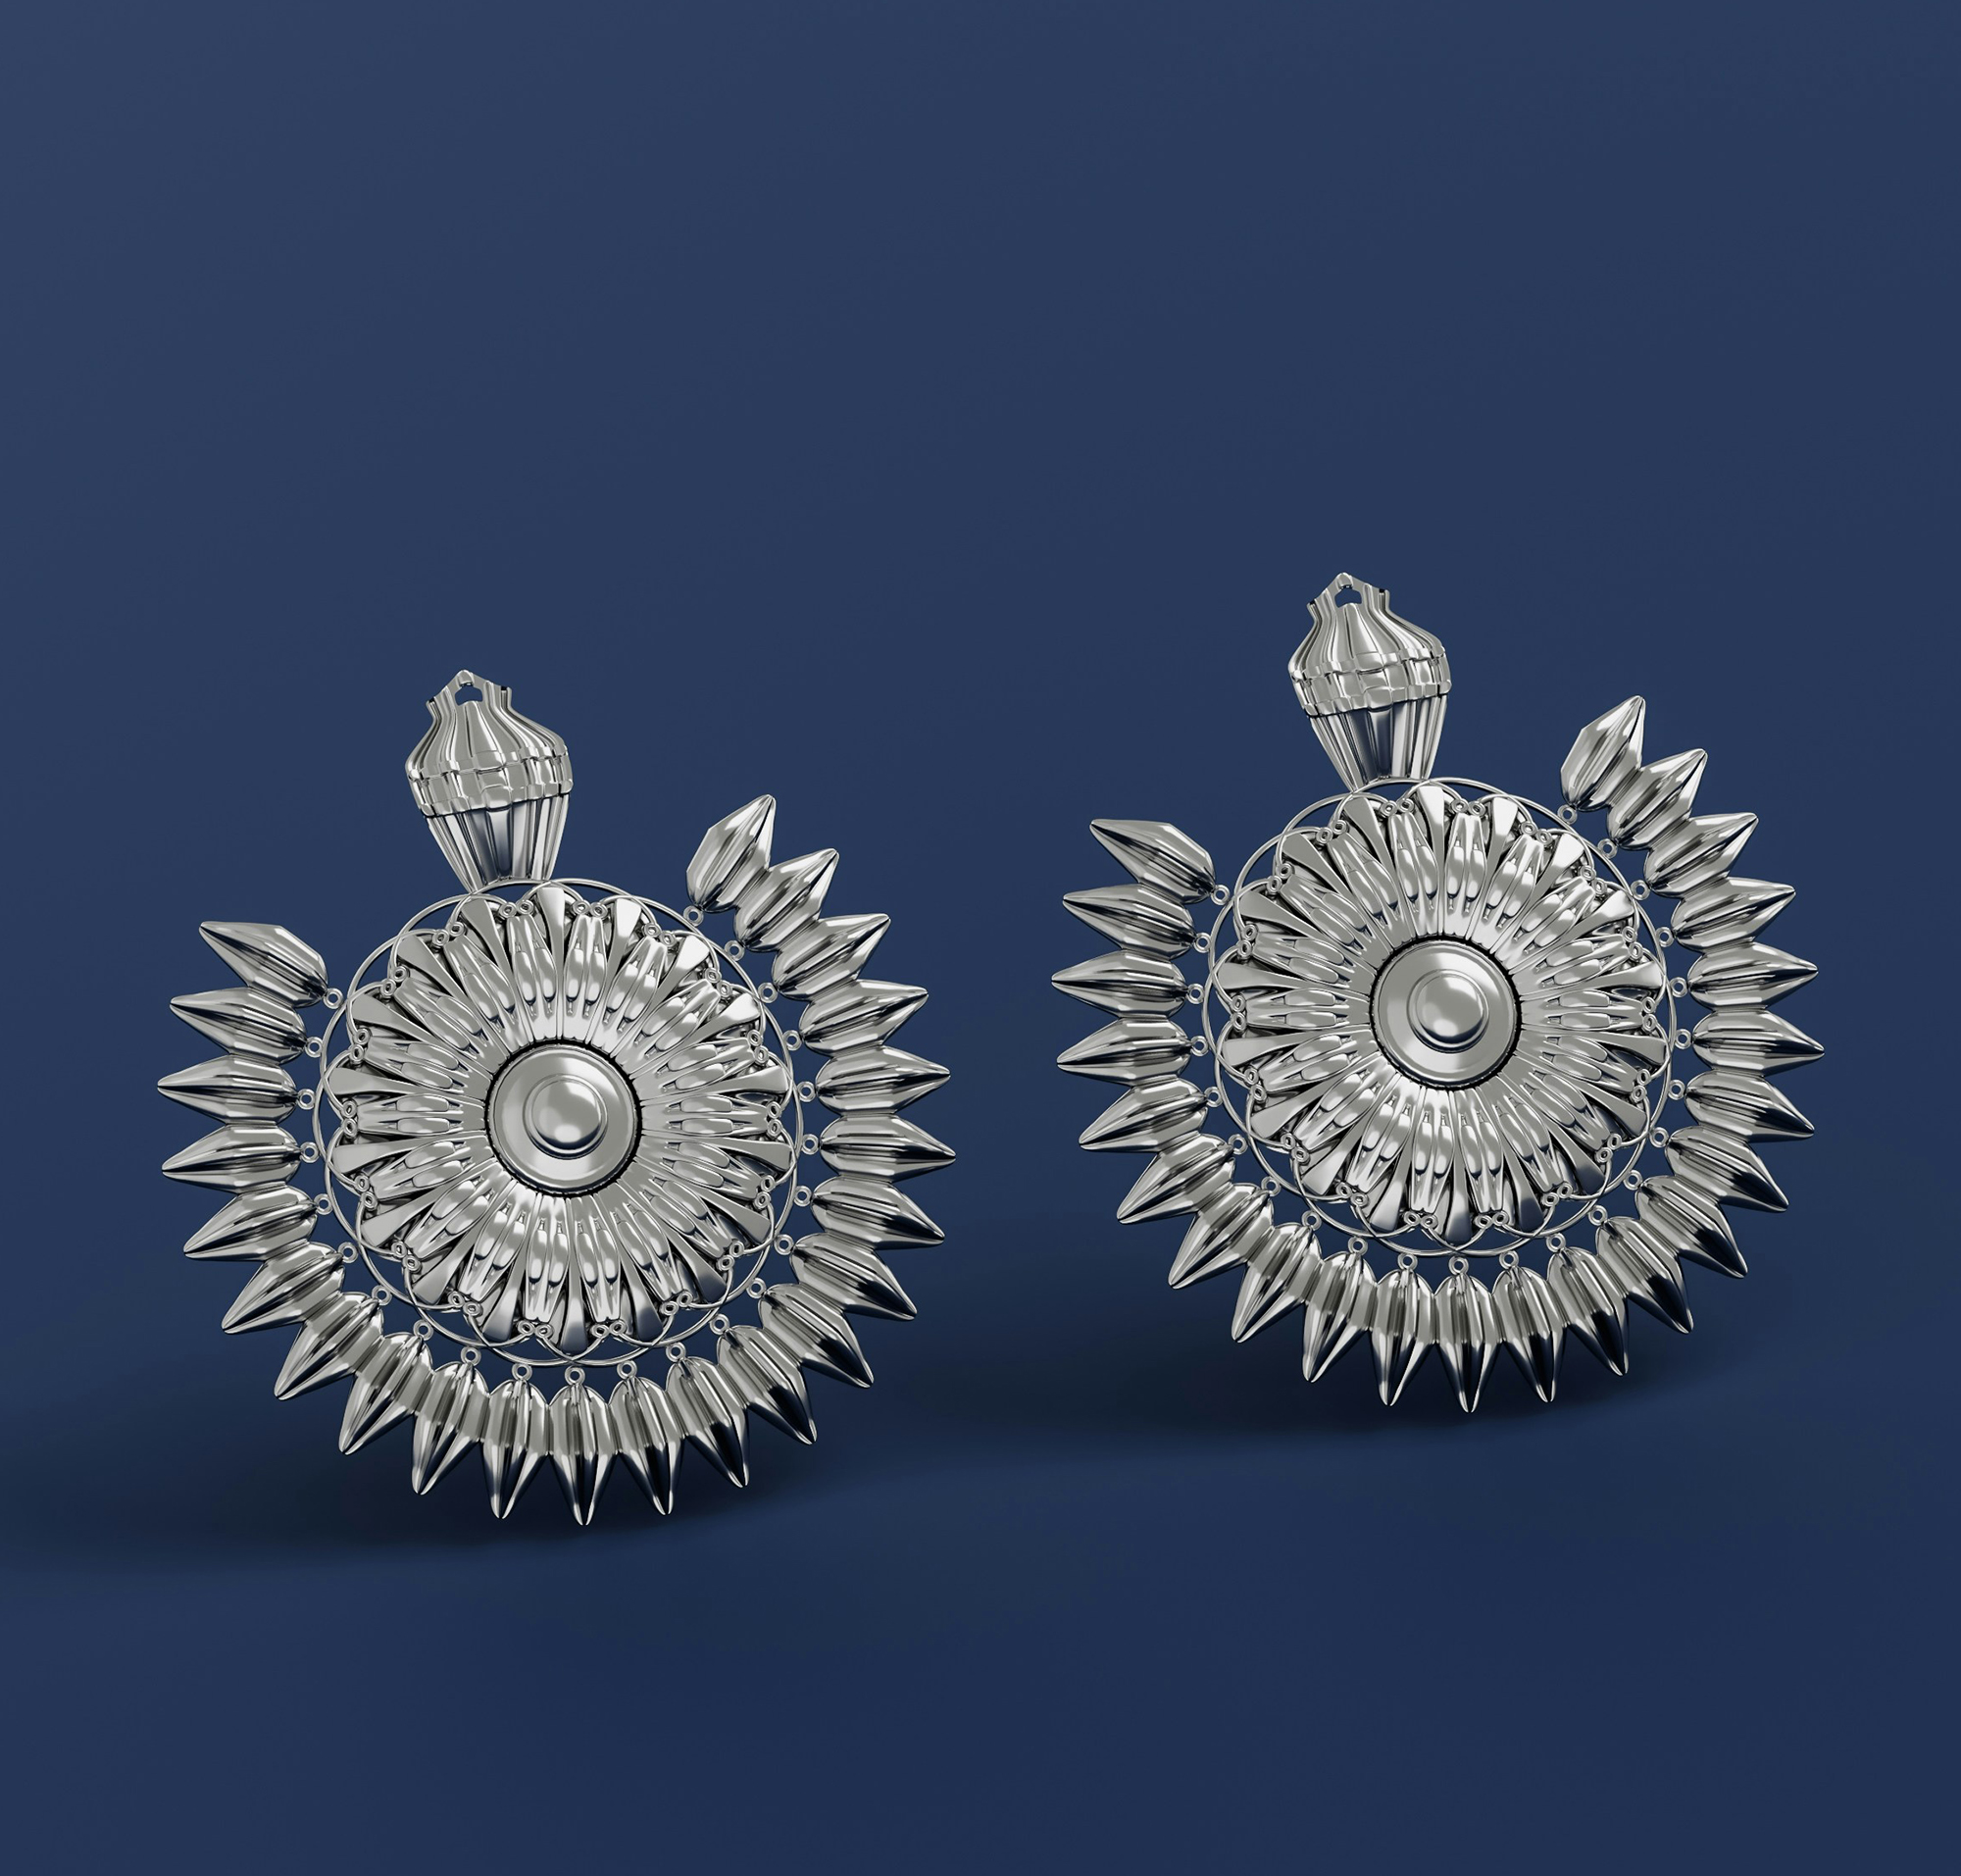
Photo credit: Pramod Tiwari on Unsplash.com.
Supply: Gains from mining and recycling
Overall, silver supply grew 7 percent in 2025 to 1,090 million ounces (33,902 tonnes), as mine production went up by 3 percent to 846.6 million ounces (26,332 tonnes). New mine ramp-ups and better ore throughput aided mine production in African and CIS nations. Russia and Morocco saw the sharpest growth at 23 percent to 56 million ounces (1,741 tonnes) and 50 percent to 11.9 million ounces (370 tonnes) respectively. South American nations Chile and Peru also saw growth of 8 percent to 42.7 million ounces (1,328 tonnes) and 7 percent growth to 130.6 million ounces (4,062 tonnes) respectively on account of the processing of higher-grade ores as well as mines reaching commercial production.
Some of these gains were offset by a fall in North American and Asian output. Mexico’s production reduced by 5 percent to 172.9 million ounces (5,377 tonnes) due to operational disruptions. A fatal mudslide resulted in a 25 percent production decline in Indonesia to 8.9 million ounces (276.8 tonnes), and China’s production grew by 3 percent to 112.8 million ounces (3,508 tonnes).
Recycling grew by 2 percent to 197.6 million ounces (6,146 tonnes), led by jewellery and silverware recycling due to the price rise. Industrial recycling was 1 percent lower at 110 million ounces (3,424 tonnes) – as each new generation of e-scrap uses less silver per device.
In 2026, silver supply is expected to fall by 2 percent to 1,066 million ounces (33,156 tonnes), even as mine output is expected to rise in Mexico and Morocco. Recycling is expected to grow by 7 percent to 211 million ounces (6,563 tonnes), driven by industrial scrap as well as jewellery and silverware scrap supply.
Demand: Investment outperforms industry
Despite a supply squeeze and rising appeal as a safe-haven asset, overall silver demand declined by 2 percent year-on-year to 1,130 million ounces (35,147 tonnes) in 2025. While industrial demand softened, its investment appeal rose multi-fold during the year. Coin and net bar demand increased by 14 percent to 217.7 million ounces (6,771 tonnes); and net exchange traded products (ETPs) investments went up by a massive 312 percent to 278 million ounces (8,646 tonnes) during the year.
Lower offtake in electricals and electronics, led by photovoltaics, reduced industrial demand by 3 percent year-on-year to 657 million ounces (20,435 tonnes). Demand for jewellery declined by 8 percent to 189.3 million ounces (5,888 tonnes), and silverware sharply by 21 percent to 42 million ounces (1,306 tonnes).
Demand is expected to decline further by another 2 percent year-on-year to 1,112 million ounces (34,587 tonnes) in 2026. A steep fall in photovoltaics could drive down industrial demand further. Elevated prices are expected to shrink jewellery and silverware demand, even as coin and bar demand could grow higher. ETP inflows might also see a decline from the high base of 2025.
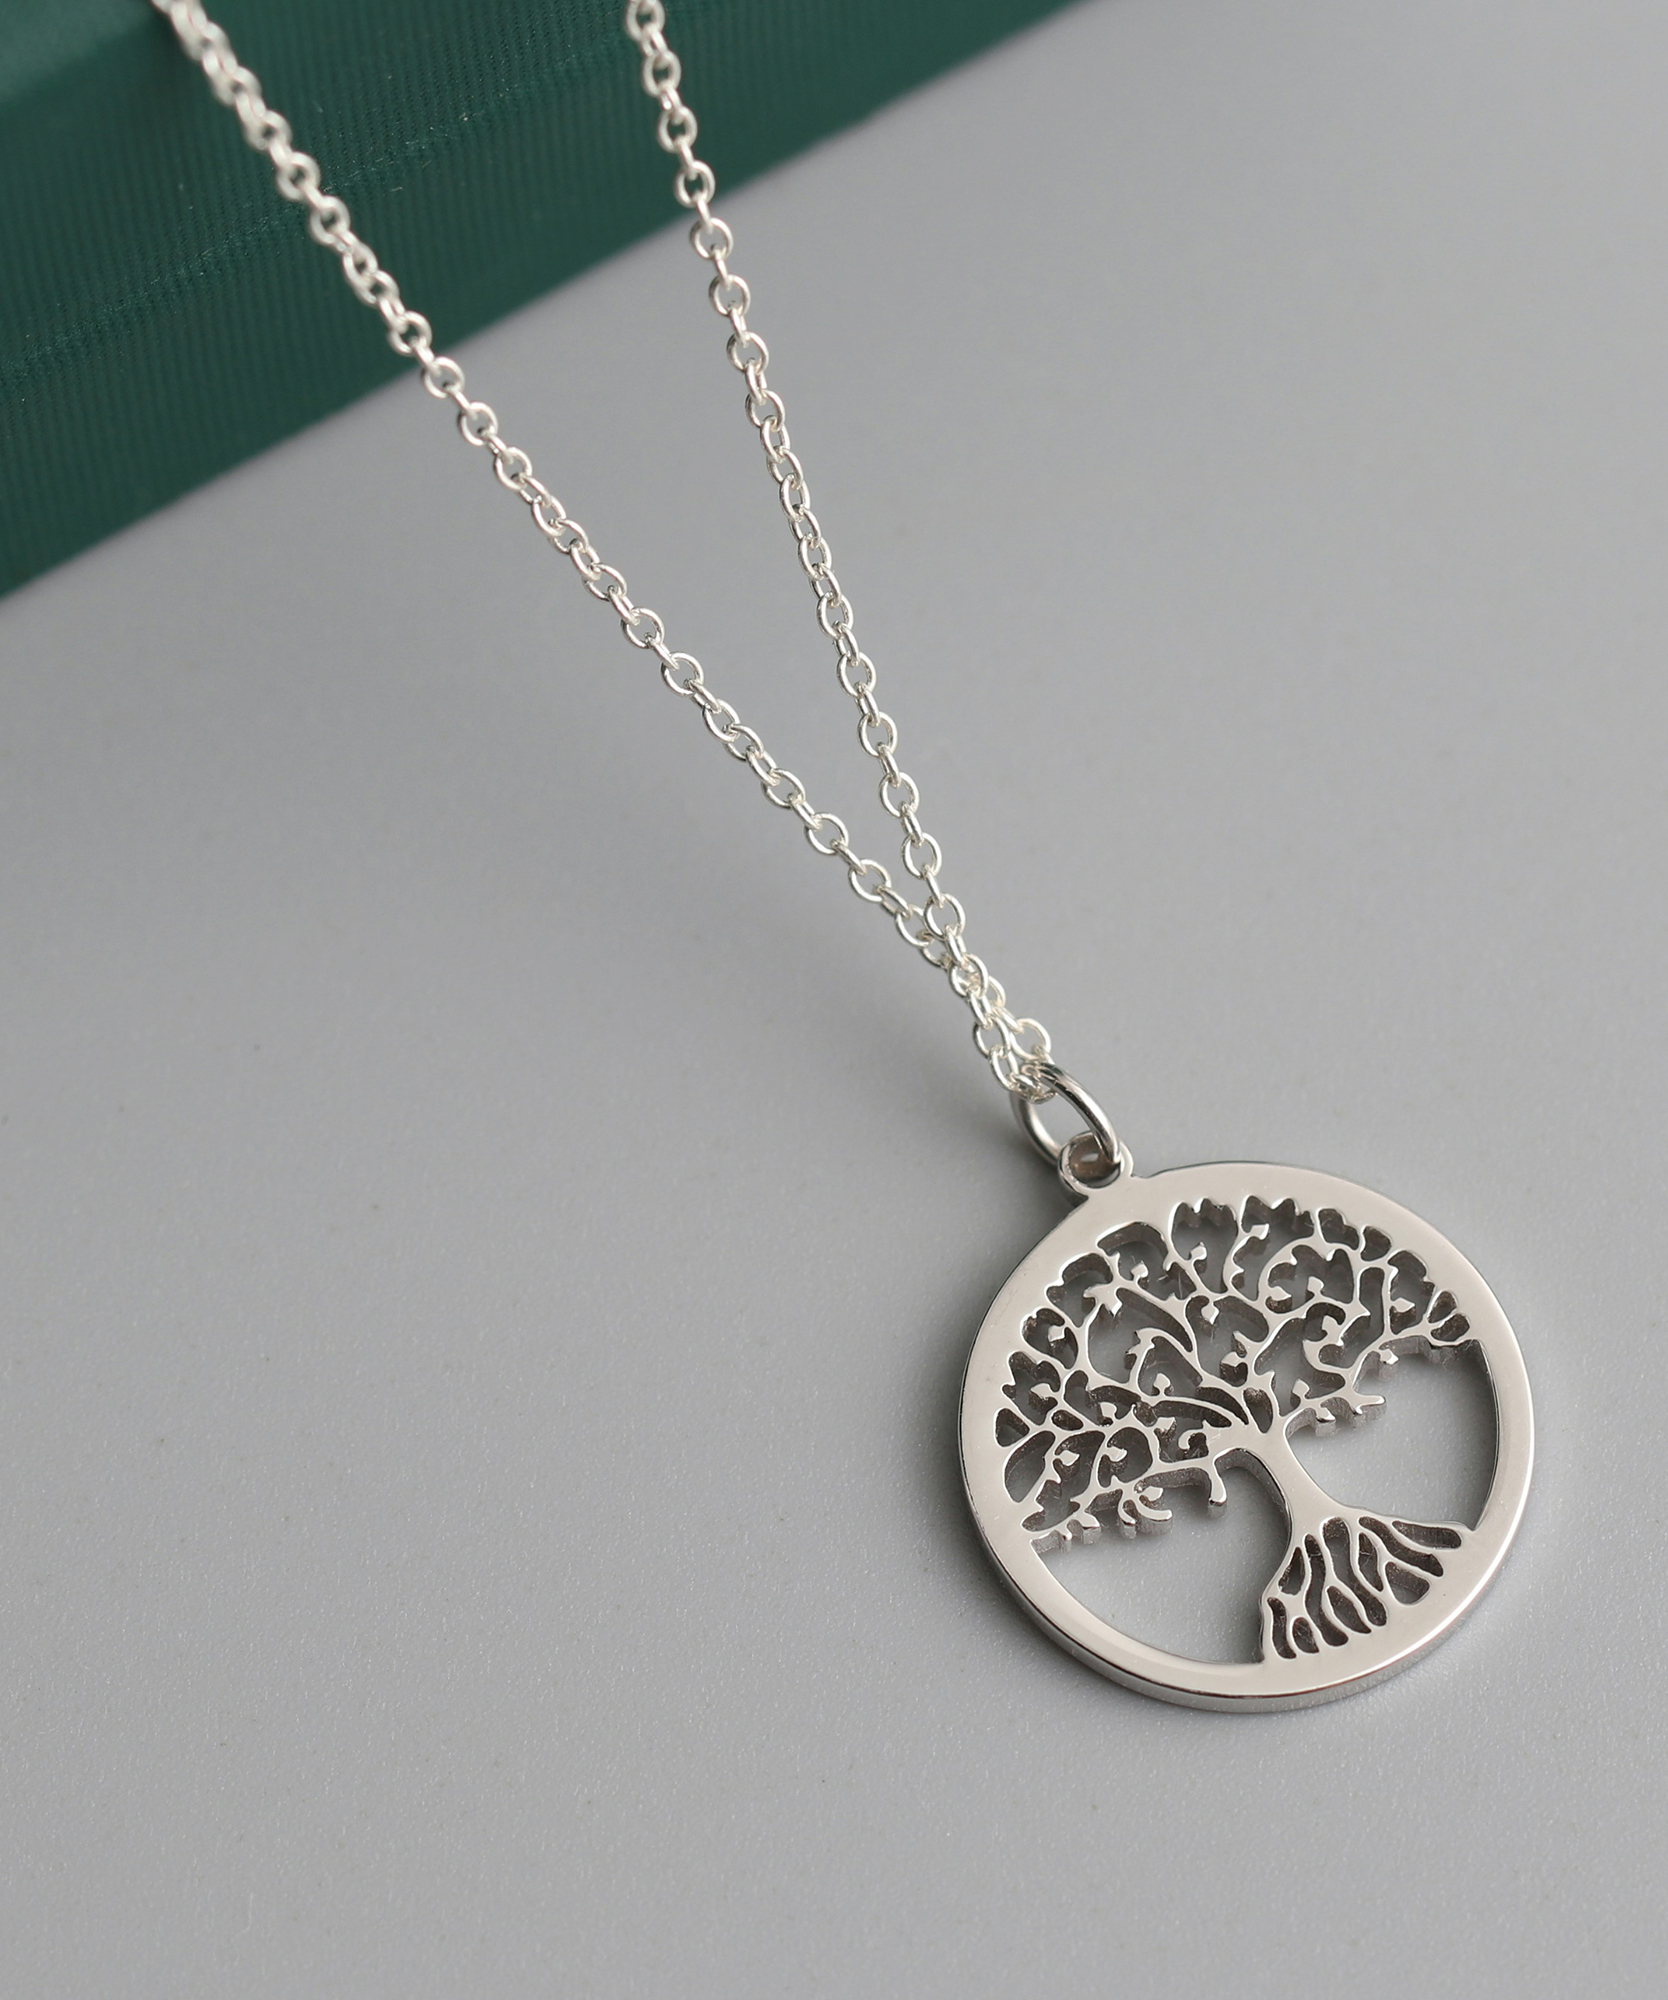
Photo credit: Fanqui on Unsplash.com.
Jewellery: Retail sentiment weakens
Silver jewellery fabrication demand diminished by 8 percent year-on-year across markets, to 189 million ounces (5,878.5 tonnes). Exporters were impacted by U.S. tariffs and retail consumption suffered due to high prices. As premiums rose on silver, it attracted the attention of large retailers and designers. Luxury jewellers like David Yurman launched silver jewellery lines, while Swarovski distributed a premium silver collection.
European fabrication demand reduced by 10 percent to 27.6 million ounces (858 tonnes), with most of the losses coming from Italy, which has an outsized exposure to the U.S. export market. Retail sales were also softer across European nations, with most large chains reporting flat growth.
The United States, the world’s second-largest jewellery market, saw its consumption shrink by 20 percent in volume. Despite expectations that higher gold prices would drive consumers towards silver jewellery, this trend did not materialise in the U.S. market.
Middle East fabrication demand increased by 2 percent to 9.3 million ounces (289.3 tonnes) in 2025. Turkey, which was in an advantageous position on account of U.S. tariffs, increased its exports to the United States, UK and Canada. Its fabrication offtake went up by 10 percent to 6.4 million ounces (199 tonnes). The rest of the countries like Egypt, Saudi Arabia and Israel saw their fabrication demand fall by 13 percent to 2.9 million ounces (90.2 tonnes).
India, which is the largest consumer of silver jewellery – making up over a third of total jewellery sales – saw its fabrication demand fall by 20 percent to 70.3 million ounces (2,186 tonnes). While exports were impacted by U.S. tariffs, retail consumption also slowed down, which dragged down total demand. Sharp price fluctuations also affected manufacturers who provide jewellery on credit while paying for bullion upfront.
However, the contraction in the Indian market must be considered benign taking into account the local price rally – which was exacerbated by the depreciating rupee. Gold-plated silver jewellery saw increased demand as a more affordable alternative to gold. This helped offset some of the weakness in rural markets, where silver jewellery demand — a key driver of consumption — declined sharply. Higher prices prompted consumers to either opt for lighter pieces or defer purchases altogether.
Large retailers launched 92.5 percent purity collections, while most others expanded their silver counters. Men’s jewellery also received a boost in the form of chains, cuffs and more.
Chinese fabrication demand went up 5 percent to 16.2 million ounces (503.8 tonnes) in 2025, reversing the trend seen in the last three years. Exports to Thailand rose, offsetting the drop from the United States and the UK. Demand for gold-plated silver jewellery increased, as consumers continued to view it as a more affordable alternative despite rising silver prices. Local demand also received a boost due to heavy promotional activities around cultural heritage. Miao silver forging techniques were promoted via WeChat programmes online, which boosted the sale of souvenirs.
In 2026, fabrication demand is expected to contract further across markets due to elevated prices. Silverware fabrication, which saw a sharp drop in 2025, is also expected to contract further in the coming year.
PALLADIUM
REBOUNDING AFTER A WEAK 2024
Palladium prices rebounded strongly in 2025, reaching a multi-year high after a sharp decline the previous year. The metal ended the year at $1,825 per ounce, up 82 percent from $1,001 per ounce in January.
Palladium prices remained rangebound during the first quarter and fell to $991 per ounce in April, weighed down by weak automotive demand. Sticky inflation prompted central banks to delay anticipated interest rate cuts, strengthening the U.S. dollar and boosting treasury yields. As speculative capital moved away from precious metals, palladium prices remained near the $1,000 per ounce level until May.
Palladium’s rally began in June, rising from around $1,150 per ounce to $1,304 per ounce in July before remaining elevated at $1,208 per ounce in August. The price was supported by supply disruptions caused by flooding in South Africa, as well as renewed investor interest driven by palladium’s relative undervaluation versus its precious metal peers.
The price recovery gained momentum following a U.S. policy decision to classify palladium as a critical mineral. The U.S. Department of Commerce launched an antidumping (AD) and countervailing duty (CVD) investigation for palladium, with allegations that Russia was dumping metal into its market.
The aforementioned events led to supply-related concerns. Automotive and other industrial players started stockpiling the metal on fears of high tariffs. This saw a sharp liquidity mop-up, as most industrial users tend to hold minimal inventory of this precious metal. Its prices saw sharp increases from $1,282 per ounce in September to $1,562 per ounce in October. Between November and December, the prices shot up sharply from $1,486 to close at $1,825 in December 2025, due to greater participation of investors.
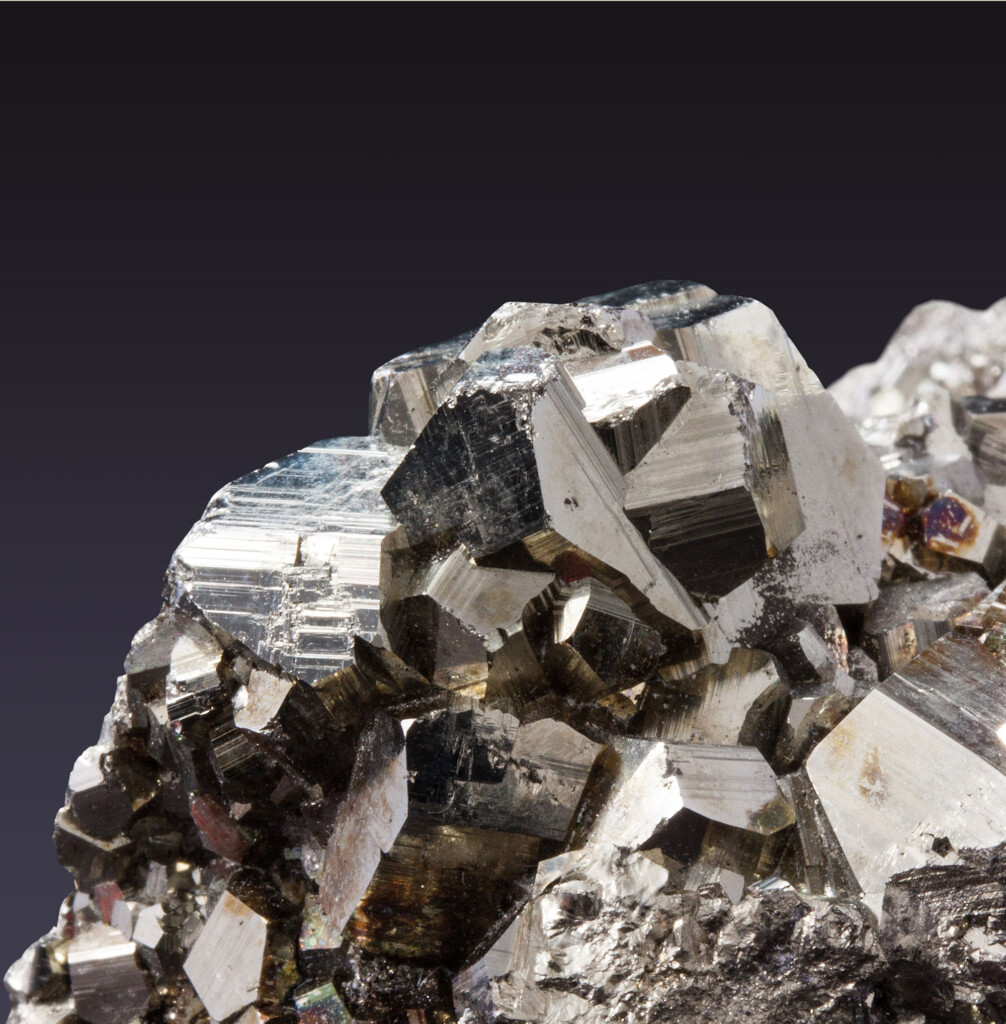
Photo credit: Pizabay on Pexels.com.
Supply: Weaker mine output, higher recycling
Palladium supply reduced by 1 percent to 9,191 thousand ounces (285.8 tonnes) in 2025, as mine production declined 4 percent to 6,311 thousand ounces (196.3 tonnes) across three key producers. Russia, which accounts for around 40 percent of total supply, saw a marginal decline of 1 percent to 2,725 thousand ounces (84.7 tonnes). U.S. output descended by a massive 38 percent to 220 thousand ounces (6.8 tonnes) as its primary producer, the Stillwater West Mine in Montana, went into maintenance. As Impala Canada neared an impending closure, it impacted North American production overall.
South African output also flattened by 5 percent to 2,246 thousand ounces (69.8 tonnes) due to floods that impacted Amandelbult mine production in the first half of the year. In addition, aging shafts and slower uptake of new ore sources pulled down the total output of South Africa. Production in Zimbabwe, however, remained steady.
Recycling supply rose 6 percent to 2.9 million ounces (90.2 tonnes) in 2025, supported by higher prices that encouraged the processing of previously unrecycled catalyst material. Auto catalyst recycling, which accounts for 85 percent of total recycling supply, increased 7 percent to 2,424 thousand ounces (75.3 tonnes) across major markets, aided by supportive policy measures. In the United States, a focus on domestic refining and strategic minerals boosted recycling activity, while China extended its vehicle scrappage incentive programme through 2025. Jewellery recycling, however, declined for another year, falling by 7 percent to 60 thousand ounces (1.8 tonnes).
The overall supply is expected to remain flat, while mine supply is expected to decline by 5 percent to 6,026 thousand ounces (187.4 tonnes). South African production is expected to grow but it would be offset by lower production in Russia and North America. Auto catalyst recycling is expected to grow by a healthy 12 percent to 2,705 thousand ounces (84 tonnes).
Demand: Electronics, chemical sectors lead
Palladium demand declined 2 percent year-on-year to 9.6 million ounces (298.6 tonnes) in 2025, reflecting weaker consumption across automotive, jewellery and industrial applications. Auto catalyst demand, the largest end-use segment, also fell 2 percent to 7,943 thousand ounces (247 tonnes), driven by declines in both the United States and China.
In the United States, tariff-related pressures weighed on vehicle production, while in China, growing adoption of hybrids and battery electric vehicles — with lower palladium loadings — reduced demand for the metal.
Industrial users have been substituting palladium with platinum due to the higher prices of the former in 2022-23. This trend did not reverse in 2025, even as palladium traded at a discount to platinum.
Industrial demand grew 3 percent in 2025 to 1,460 thousand ounces (45.4 tonnes), driven by a 6 percent increase in electronics demand to 701 thousand ounces (21.8 tonnes), 8 percent growth in chemicals to 475 thousand ounces (14.7 tonnes) and a 70 percent rise in hydrogen applications to 7 thousand ounces (0.218 tonnes). However, these gains were insufficient to offset the weakness in automotive demand. Jewellery demand also declined, while physical investment demand fell sharply by 31 percent to 2 thousand ounces (0.062 tonnes).
The demand for palladium in 2026 is expected to be flat or drop marginally. Demand from the automotive sector is expected to either fall or remain flat due to an uncertain economic outlook as the trend of ICE market share in global vehicles continues to drop. However, some of this could be offset by palladium-to-platinum substitution as the former is trading at a discount to the latter.
Industrial demand expectations are also flat as the growth seen in electronics could be offset by weakening in chemicals demand, due to conflict-related disruptions in the global fertiliser sector across the world.
Jewellery: A four-year low
Palladium fabrication demand came in lower by 6.8 percent year-on-year to 218 thousand ounces (6.7 tonnes) in 2025 – hitting a four-year low. As European white gold demand reduced, palladium, which is used as an alloying agent, also saw a sharp fall.
In 2026, jewellery demand is expected to fall by 12 percent to 192 thousand ounces (5.9 tonnes). The price rise seen in 2025 will push up retail prices, possibly depressing white gold demand even further. Carat palladium, already a small component of the total jewellery segment, is expected to contract further.
CONCLUSION
2025 was a defining year for precious metals. Heightened geopolitical and economic uncertainty strengthened their appeal among both institutional and retail investors, driving prices to record highs and reshaping consumer behaviour. As consumers adapted to higher prices through lower-carat jewellery and substitution into alternative metals, the resilience and relevance of precious metals remained evident.
Looking ahead, the West Asia crisis, elevated energy costs and the pass-through effects of tariffs are expected to keep markets volatile and consumer sentiment cautious in 2026. Yet, precious metals are likely to remain well supported by their enduring role as stores of value and portfolio diversifiers. At the same time, growing scrutiny of supply chains will place greater emphasis on provenance, traceability and ESG credentials, making responsible sourcing an increasingly important driver of competitiveness and consumer trust